Falling Concrete and Sturdy Dykes. The Economic Differences Between Belgium and the Netherlands
With the support of the Marshall Plan, the Netherlands and Belgium were able to gradually improve their economies after 1945. Both countries have open and well-functioning economies that share many similarities, yet they have been drifting apart since the 1980s. According to Ewald Pironet, Belgium is a stagnant state where reform and adjustments often come too little and too late. The Netherlands, in his opinion, looks ahead and plans better. Seventy-five years on from the end of World War II, the differences between Belgium and the Netherlands from an economic perspective are significant and growing.
It was an odd report that appeared in the international press in 2018: ‘Dutchman fills potholes in Belgian street with flowers.’ Anton Schuurmans, a Dutch national living in Brussels, was so disturbed by the number of potholes in the Belgian roads that he decided to do something about it, and in a rather amusing manner: he filled hundreds of potholes with compost and planted irises, anemones and crocuses in them. The Dutch often joke that their cars start to shudder when they cross the border into Belgium. ‘Unfortunately, it’s not a joke, but reality,’ says Schuurmans.
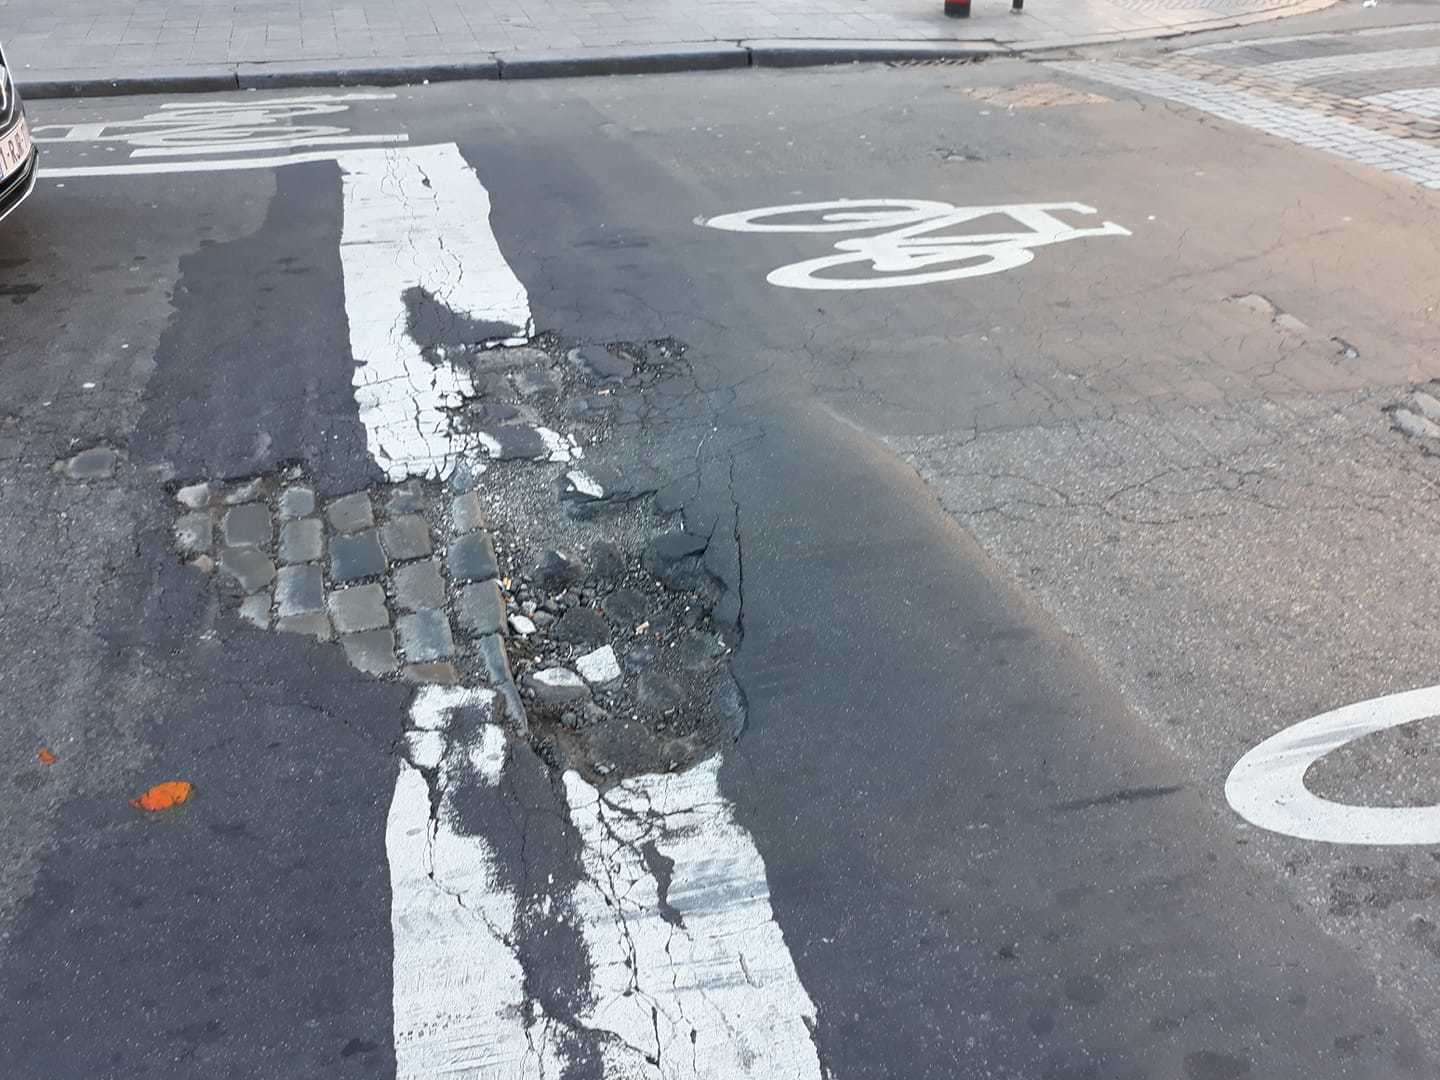 Pothole in a Brussels road
© Facebook Anton Schuurmans
The Belgian roadways are in a much worst state than those of the neighbours to the North. This statement is supported by research done by the World Economic Forum (WEF). In the Global Competitiveness Index the WEF publishes the annual ranking of national economies according to their competitiveness. The quality of the roads is one of the criteria. The Netherlands sits in third place out of 140 countries, just after Singapore and Switzerland. Belgium takes 52nd place and hangs at the back of the European rankings; only Italy ranks lower. What makes this even worse: the Netherlands keeps rising in the rankings, Belgium loses ground every year. This is not ideal for a country that calls itself the ‘logistics hub of Europe.’
Both countries share not only a geographical border but also have relatively small, open economies
The large and growing difference between Belgium and the Netherlands on such a critical point as infrastructure is remarkable considering that both countries share not only a geographical border but also have relatively small, open economies. In the first decades after the Second World War they also shared a fairly parallel history. After 1945, both struggled but soon enough work began on social services and the development of a welfare state. In Belgium, this happened under the leadership of the Belgian socialist Achiel Van Acker, who is known to history as “the father of social security”. In the Netherlands, it was Willem Drees, another socialist, who instigated a range of popular social security laws and earned the nickname “Daddy Drees”.
Golden Sixties
Additionally, there was a move towards more ‘European’ thinking. That is why the Benelux, a union of Belgium, the Netherlands and Luxembourg, was founded in 1944. In 1951, the Benelux, in collaboration with Germany, France and Italy created the European Coal and Steel Community (ECSC), a first attempt at European cooperation. Six years later, Rome followed with the treaties that established the European Economic Community (EEC) and in 1968 the six founding nations abolished import duties on goods. This internal European cooperation increased trade and prosperity.
 One of a number of posters created by the Economic Cooperation Administration, an agency of the U.S. government, to sell the Marshall Plan in Europe.
© Wikipedia
At the same time, there was another, external stimulus. Like most Western European countries, Belgium and the Netherlands both benefitted from America’s Marshall Plan for re-building. Concretely, this was about money, goods, raw materials and food supplies that were given to Europe by the Americans partially as gifts, partially in the form of loans.
This support paved the way for American multinationals such as Ford, to find new production opportunities and trading markets here. American culture followed swiftly behind, perhaps most clearly via music: by the end of the 1950s rock-‘n-roll was popular in Europe, records by Elvis Presley, Bill Haley, Chuck Berry, Buddy Holly and other rousing hip-shakers were bought and played. This illustrates the beginning of the consumer culture: money, too, was expected to rock, and especially, to roll. Not only records and record players, but also televisions, refrigerators, washing machines, vacuum cleaners, scooters, autos and more were eagerly bought. It seemed like the sky was the limit!
(continue reading below the illustration)

© Trui Chielens
The Engine Cuts Out
Since the Second World War the economies of the two countries – and throughout the entire world – grew strongly but then in the 1970s there was suddenly an oil crisis; both Belgium and the Netherlands were hit hard. The Yom Kippur War broke out in 1973. The fight between Israel and Arabic states such as Syria and Egypt led to a drastic rise in oil prices. This shook the foundations of the Western economies. One result was that Belgium instigated six car-free days between November 1973 and the start of 1974. In the Netherlands, there were ten – not due to environmental concerns as we see nowadays but because there was the threat of an oil shortage. This ended les trente glorieuses (thirty glorious years), as the French economist Jean Fourastié called the period of prosperity between 1945 and 1973.
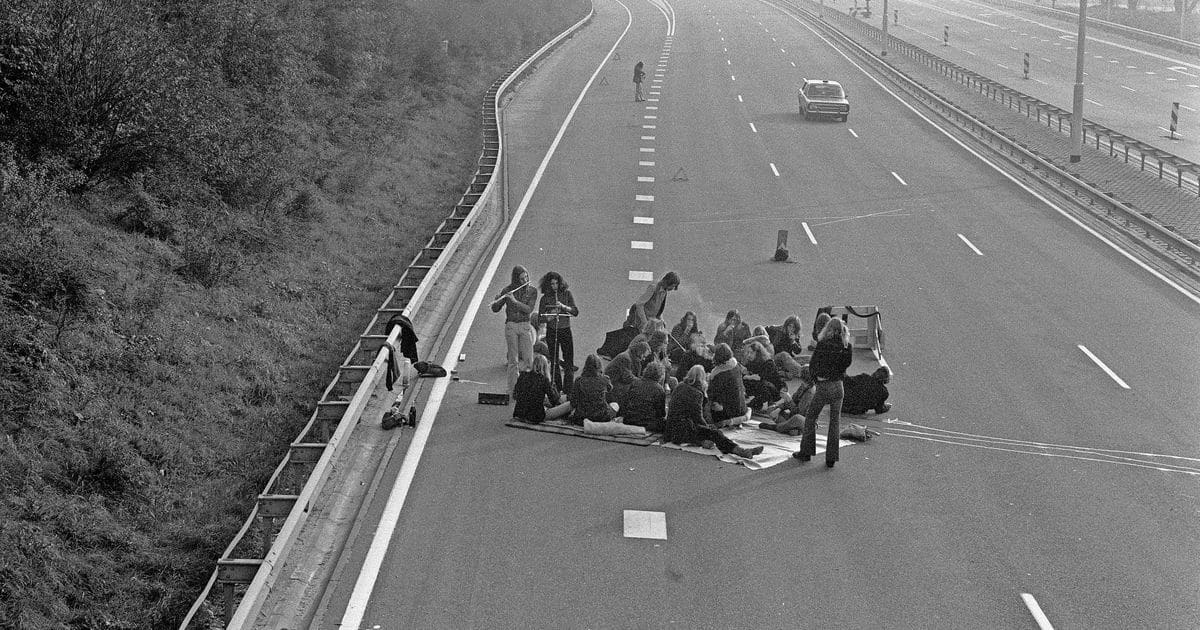 Highway in the Netherlands on a car-free Sunday in 1973.
It was hard to wake up from the Golden Sixties. In both the Netherlands and Belgium, unemployment rose significantly in the 1970s. The aging, traditional sectors such as mining, steel and textile production in Belgium could no longer survive and the huge, new multinationals such as Philips started ‘downsizing’, which effectively meant throwing masses of people out of work. More and more people had to fall back on a replacement income. Costs increased, unions demanded high wages, industry leaders factored the increased wages into their prices – it became a vicious circle. Governments watched their incomes fall while their costs rose. The West, including Belgium and the Netherlands, wrestled with an existential crisis: the necessity to make the transition from an industrial to a post-industrial economy.
In the Netherlands, the economy suffered most from the 1973 oil crisis. In Belgium the second in 1979 was fatal
The first oil crisis in 1973 was a critical hit to the Belgian economy, the second oil crisis in 1979 was fatal. Then the Shah of Iran, Mohammed Reza Pahlavi, had to flee the Iranian Revolution and make way for the Islamic leader Ayatollah Khomeini. Once again, oil prices skyrocketed. Salaries were connected to inflation and the increases in longevity by a unique index mechanism. Belgium priced itself out of the market. The exploding unemployment figures and social security costs led to a dramatic increase in the deficit. That laid the foundation for a mile-high debt mountain. Three illustrative figures: in 1975, Belgium’s national debt was equal to 60 percent of the gross domestic product (GDP); ten years later, this had doubled to 122 percent and at the start of the 1990s it reached 140 percent. Belgium came to be known as ‘the sick man of Europe’.
In the Netherlands, the economy suffered most from the 1973 oil crisis. The progressive governments maintained a focus on guaranteed incomes, new benefits, redistribution, public works projects and so on, which cost fistfuls of government money. The second oil crisis six years later was also too much for the Netherlands to handle: more and more companies closed their doors and between 1983 and 1984 unemployment reached and all-time high. Three figures representing the Dutch government deficit: in 1975 it was 45 percent of GDP, ten years later it was 76 percent and at the start of the 1990s it was hovering just above 70 percent. Note the enormous difference with Belgium: in 1975, the Belgian deficit was just 15 percent higher than in the Netherlands but by the early nineties it was nearly double that of the northern neighbours.
‘A solidified state’
What happened around 1980 that led to such different economic evolutions in Belgium and the Netherlands? There are likely several causes. Some went far back in time and pointed to the Calvinistic frugality of the Dutch. Or perhaps it was their commercial spirit, of which the Dutch East India Company (1602-1800) was a perfect example. Then there are the different entrepreneurial styles. Many Dutch companies such as Philips, Royal Dutch, C&A, Unilever, Heineken, to name just a few, knew how to conquer the world’s markets. In Belgium things progressed differently. Belgium lost its big companies, often to France; think of Petrofina, Tractebel, Electrabel and others.
 In 1959, the largest natural gas field in Europe was discovered in the vicinity of the Dutch village Slochteren, ensuring the position of the Netherlands as a major energy exporting country.
© Wikimedia Commons
Then, of course, there was the discovery in 1959 of natural gas fields near Slochteren, which allowed the Netherlands to become the second major producer of natural gas in the European Union. Revenues from gas extraction from 1965 to the present day amounted to more than 400 billion euros for the Dutch government. That’s certainly worth more than a sip of buttermilk!
But these events all took place before the economies of Belgium and the Netherlands started to drift apart. The most important reason is that Belgium is (was and remains) a “solidified state,” to use the title the historians from Louvain gave to their economic history of Belgium: there was no movement, no initiative, not even an attempt to climb out of the economic morass into which the country had sunk after two consecutive oil crises. It seemed that people in Belgium either did not understand the situation or did not want to understand it.
 Wilfried Martens, Prime Minister of Belgium, 1982
© Wikipedia
In 1981 the financial shortages of the Belgian government rose to 15 percent but the then Budget Minister, the francophone Socialist Guy Mathot didn’t care. He legendarily claimed that ‘the shortage came about by itself and will disappear in the same way.’ Between 1979 and April 1981 four governments failed due to community, party and crisis-related issues. The Christian Democrat Prime Minister of the day, Wilfried Martens, was unable to pursue a decisive policy. The animosity between employers, employees and the unemployed grew.
In 1982, Belgium devalued its currency by 8.5 percent. This devaluation was crucial if Belgium was to maintain any competitiveness at all. Three years later, Martens promised that there was ‘light at the end of the tunnel,’ but Belgium continued to wander in the darkness. A balanced budget has still not been achieved up until today – or only narrowly (and then only due to some clever bookkeeping). At the start of the financial crisis in 2008 the Belgian deficit stood at 90 percent of GDP, half again as much as the 60 percent outlined in the European Stability and Growth pact as the maximum.
The Polder Model
How different it was in the Netherlands during this time! In 1982 the deficit reached its maximum of 9 percent. That year, the first cabinet under the leadership of the Christian Democrat Ruud Lubbers was formed with fellow party member and “emotionless mathematician” Onno Ruding as Minister of Finance – a greater difference in character between him and his Belgian counterpart Mathot is unimaginable. Lubbers delivered a decisive, no-nonsense, three-pronged policy with three objectives: to reduce the deficit by limiting public expenditure, including a salary reduction for civil servants; to put more people to work; and to take a few bites out of the social security expenditures.
 Ruud Lubbers, Prime Minister of the Netherlands, 1985
In the same year, 1982, the Treaty of Wassenaar came into effect in the Netherlands. Under this treaty, workers agreed to wage moderation, and, in return, employers agreed to shorten the work week and redistribute the work. Later, this Dutch consensus model in which employers, unions and the government sit together to negotiate terms of employment and wages came to be known as the Polder Model. Between 1985 and 1994, the Netherlands attracted a great deal of attention with its average economic growth of 2.5 percent per year. Because of this, people speak of the Dutch economic miracle. In 2008, the deficit in the Netherlands stood at 55 percent, thus nicely under the European requirement of 60 percent.
Two gaps
The Netherlands suffered more from the financial crisis of 2008 than Belgium, because there was a crisis in the housing market, amongst other reasons. According to some economists, the housing bubble in Belgium has yet to burst. Unemployment increased more in the Netherlands than in Belgium and there was more loss of income. In the early years, Belgium withstood this crisis better than most other EU member states, including the Netherlands, because the Belgian government put forward a social politics model and just let the budget deficit increase. The Netherlands reacted in a completely different way: it made drastic spending cuts and put forward many major reforms.
For example, in 2012, the Netherlands decided to raise the retirement age from 65 to 67 and that change took place over a very short period. Today, the legal retirement age is 66 years and four months; in 2024 it will rise to 67 years. In Belgium, this increase only started to come into effect in 2015 and the transition will take much longer: the legal retirement age will rise from 65 to 66 in 2025, and to 67 in 2030. In this, Belgium is six years behind the Netherlands.
Thanks to its structural reforms, the Netherlands is in better condition than Belgium
Thanks to its structural reforms, the Netherlands is in better condition than Belgium. The liberal Dutch Prime Minister, Mark Rutte, mentioned this a little while ago. When he faced opposition to a tax reform, he withdrew, saying: ‘If the Netherlands does not abolish the tax, it will go the same way as Belgium. We have seen what happens in Belgium if you don’t move the guideposts on time.’ This comment was not well-received by his neighbours to the South. His liberal friend, former Belgian Prime Minister Charles Michel, was displeased by this remark but Rutte offered his apologies, saying: ‘Maybe I should not have put it that way, but I fear that what I said is, in fact, true.’
The numbers show that Rutte is right. The Dutch economy has a growth rate of nearly 3 percent while Belgium’s is barely half that amount. The Netherlands has been closing its annual financial statement with a surplus budget; last year, that surplus was 2 percent of GDP, or about 12 billion euros. Belgium, conversely, has recorded year-in-year-out budget deficits of 0.7 percent or more; in 2018, of more than 3 billion euros. The Dutch government debt is around 52 percent; Belgium’s more than 100 percent. And so it continues. The Netherlands is much better prepared should a new economic crisis appear – and sooner or later, one will.
The differences of unemployment between the provinces are enormous in Belgium
It is often noted that the Belgian numbers are dragged down by the poor performance of the economies of Brussels and Wallonia. That’s true. Take the unemployment levels, for which regional and provincial figures are available. In the Netherlands, these are around 3 percent, in Belgium, 6 percent. If we take a closer look at that figure, we notice that unemployment in Flanders stands at only 3.5 percent, in Wallonia nearly 9 percent and in Brussels more than 13 percent. The differences between the provinces are enormous in Belgium: the highest level of unemployment can be found in the Walloon province of Hainaut (12 percent), the lowest in the neighbouring provinces of East- and West-Flanders (slightly more than 3 percent). For comparison: in the Netherlands, unemployment is highest in Groningen (4 percent) and lowest in Zeeland (3 percent).
But Flemish performance still lags behind the Dutch: the rate of employment, for example the number of 20 to 64-year olds in work, is 75 percent in Flanders, 80 percent in the Netherlands. In October 2019, the new Flemish government came in with the goal of getting the rate of employment in Flanders up to 80 percent. Flanders does a lot of chest-pounding about their results in comparison to Wallonia, but if you look at the numbers in the Netherlands, you see that much more progress is possible. In the Low Countries there are not only economic gaps between Flanders and Wallonia but also between the Netherlands and Flanders. And these gaps continue to grow.
Happy Dutch
The Netherlands performs better in many financial/economic areas. But when it comes to government spending Belgium is at the top of the heap with 52 percent of GDP. Dutch government spending is 42.5 percent of GDP. That the Belgian government spends so much is, in itself, not a problem, as long as the taxpayer gets something in return for his money. Belgium gets high marks in health care and education although francophone education is below the norm and Flemish education seems to be losing ground.
 According to the World Happiness Report, the Netherlands is the fourth happiest country, while Belgium is the eighteenth.
In other areas, Belgium doesn’t seem to be performing very well. For example, when it comes to the quality of government administration, the Netherlands has earned second place in the oft- cited Global Competitiveness Index, after Singapore. Belgium is ranked number 31. This is probably because Belgian civil servants are more likely to be promoted based on their political affiliations than their competence. And the Netherlands also scores better in some social areas. The Dutch poverty rate of 13 percent is clearly less than Belgium’s rate of 16 percent. The rate of poverty for low-skilled workers between the ages of 20 and 64 is 18 percent in the Netherlands, more than 30 percent in Belgium. According to the World Happiness Report, the Netherlands is the fourth happiest country, while Belgium is the eighteenth.
Dutch economist Mathijs Bouman prepares an annual ‘ranking of the rankings.’ He includes not only the World Happiness Report
and the Global Competitiveness Index, but also other, competing indices such as the World Competitiveness Ranking. He also looks at the and the Human Development Index, which amongst other things, assess the quality of education and health. In Bouman’s ‘Ranking of Rankings’ the Netherlands is in second place, after Switzerland. Belgium is in 20th place. That about sums it up.
Falling Concrete
Belgium’s humpty-bumpty roads symbolise the problem. Sky-high taxes combined with an abominable infrastructure have been called “the Belgian paradox.” There is a reason for this mess: in a bid to bring some order to public finance, the Belgian government has neglected investment in infrastructure since the 1980s. They won’t put money into new roads, maintenance, lighting, bicycle paths, drainage and so on. After a while, there are repercussions and we begin to see concrete falling from the tunnels in Brussels. Growth expert Wim Moesen (University of Louvain) put it concisely: ‘The Belgian politicians followed the path of least resistance in their savings-plans, but that is also the path of least intelligence. Less public investment leads to inferior infrastructure. That is a short-sighted policy.’
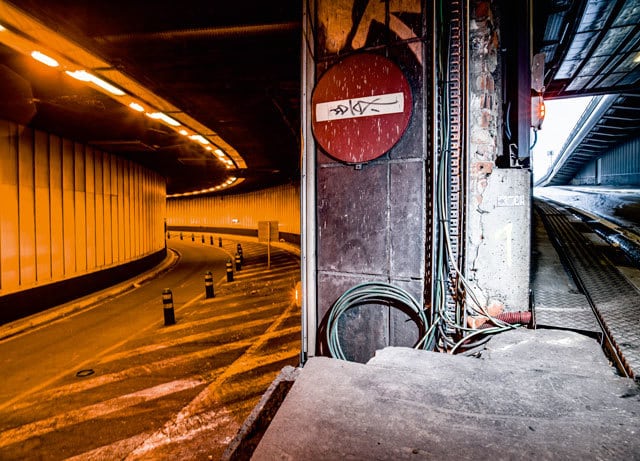 Due to years of neglect, debris regularly fell into the Brussels car tunnels.
Belgian short-sightedness comes into play in many areas, whereas Dutch policymakers seem to have an eye on the long-term. Symbolic of that are the sturdy dykes and flood barriers that protect the Netherlands against rising water. Is it, in fact, through their need to defend themselves constantly against flooding that the Dutch have developed the ability to see two-hundred years ahead when it comes to other problems? Is there an attitude of ‘let’s-see-what-happens-tomorrow’ or even ‘aprés moi, le deluge’ (it won’t be my problem anymore) in Belgium? Does it have to do with the Dutch-Calvinist belief in hard work and frugality? Today, 75 years on from the Second World War, the differences between the economic situations in the two countries are significant and increasing.
This article is the English translation of Vallend beton of stevige dijken. Economische verschillen in de Lage Landen, published in the book Nulpunt 1945 (Zero Point 1945, Ons Erfdeel vzw, 2020).

Comments
The comments section is closed.You might also like